The Economics of CI/CD: What Slow Pipelines Are Really Costing You
 By
By
Introduction
Most teams classify slow pipelines as a technical annoyance. Builds are a little slow, tests are a little flaky, and deployments are a little delayed, so the pain gets absorbed as normal engineering friction. That framing is expensive.
Pipeline latency is not just a developer experience issue. It is a capital allocation issue. Every minute engineers spend waiting for build, test, or deployment feedback is paid engineering time not creating customer value. At scale, this is measurable opportunity cost.
This article translates pipeline speed into business language. It shows how to model waste, quantify opportunity cost, and present CI/CD investment as a high-ROI business case to finance and executive stakeholders.
The Hidden Cost of Pipeline Idle Time
If one engineer waits 10 minutes, it feels trivial. If 50 engineers wait 10 minutes multiple times per day, it becomes a budget line.
A practical numerical estimate for such wait costs follows:
Annual Wait Cost = Total Wait Time per Year x Dollar Cost per Year
Expanding this into the world of engineering:
- Annual Wait Minutes = Engineers x CI Events per Day x Wait Minutes per Event x Working Days
- Annual Wait Cost = Annual Wait Minutes x Loaded Cost per Engineer-Minute
Where loaded cost includes total compensation (salary, benefits, and overhead) and a CI event is any time a developer triggers a pipeline then waits for feedback. If a fully loaded engineer cost is $180,000 per year and you assume 220 working days at 8 hours per day, the loaded cost is approximately $1.70 per engineer-minute.
Example with conservative assumptions:
- 40 engineers
- 6 CI feedback events per engineer per day
- 8 minutes average avoidable wait per event
- 220 working days per year
- fully loaded annual cost of $180,000 per engineer
This yields 422,400 wait minutes per year, or 7,040 engineer-hours. At roughly $1.70 per engineer-minute, that is about $718,000 of annual loaded engineering cost tied up in avoidable waiting. Even if only a portion of that time is truly unrecoverable due to context switching, the financial waste is still substantial.
And unrecoverable time is the key. Developers rarely pause in a fully reversible state. They context switch. They answer chat. They start unrelated work. Then they pay re-entry cost when feedback arrives. So the true loss is often greater than the raw wait minutes.
Lead Time Is Not a Technical Metric, It Is a Business Metric
The Three Ways and DORA research shifted the industry from activity metrics to system metrics. Lead Time for Changes, Deployment Frequency, Change Failure Rate, and MTTR are not vanity indicators. They are leading indicators of delivery capability.
Why that matters financially:
- Long lead time delays value realization for shipped features.
- Low deployment frequency increases batch size and failure blast radius.
- High MTTR increases downtime cost and customer impact.
- High change failure rate creates rework and trust erosion.
Fast pipelines directly influence the first two and indirectly improve the latter two by encouraging smaller, more frequent, lower-risk changes.
The common analogy is to view lead time as analogous to inventory turnover in manufacturing. If code takes weeks or months to move from commit to production, capital is tied up in partially completed value. Faster lead time increases throughput of value-producing work with the same headcount.
This is why high-performing delivery organizations consistently show better business responsiveness. They can test market hypotheses faster, ship fixes faster, and adapt strategy faster.
The Opportunity Cost, Features You Are Not Building
Labor cost is only half the economic picture. The larger cost is foregone output.
Every hour spent waiting on or nursing pipeline behavior is an hour not spent on:
- revenue-generating features
- reliability improvements
- customer-facing defect reduction
- security and compliance hardening
- technical debt with clear future payoff
A simple opportunity-cost model:
Foregone Feature Capacity = Recoverable Pipeline Time x Feature Throughput Rate
If a team recovers 10 percent of engineering time by reducing CI/CD friction, that can translate into materially more roadmap delivery without hiring.
McKinsey's developer productivity work emphasizes this point: developer productivity is fundamentally about reducing friction and increasing the share of time spent on high-value coding and design work. The strategic question is not whether teams are busy. It is whether their time allocation is economically optimal.
Hiring is expensive and slow. Improving delivery economics by reducing pipeline drag often has a shorter payback period than expanding headcount.
What Real Economics Looks Like in Practice
The specific numbers vary by company size and stack, but the pattern is consistent:
- teams reduce pipeline latency and flakiness
- feedback speed improves
- batch size shrinks
- lead time and failure characteristics improve
- effective delivery capacity increases
Public case studies from high-performing engineering organizations repeatedly show the same mechanism: speed and reliability improve together when feedback loops are tightened and operational discipline is strong. DORA 2023 data consistently shows this pattern: elite-performing teams achieve deployment frequencies in the on-demand range, lead times for changes under one hour, and change failure rates below 5%, while low performers operate at monthly or less deployment frequency and multi-week lead times.
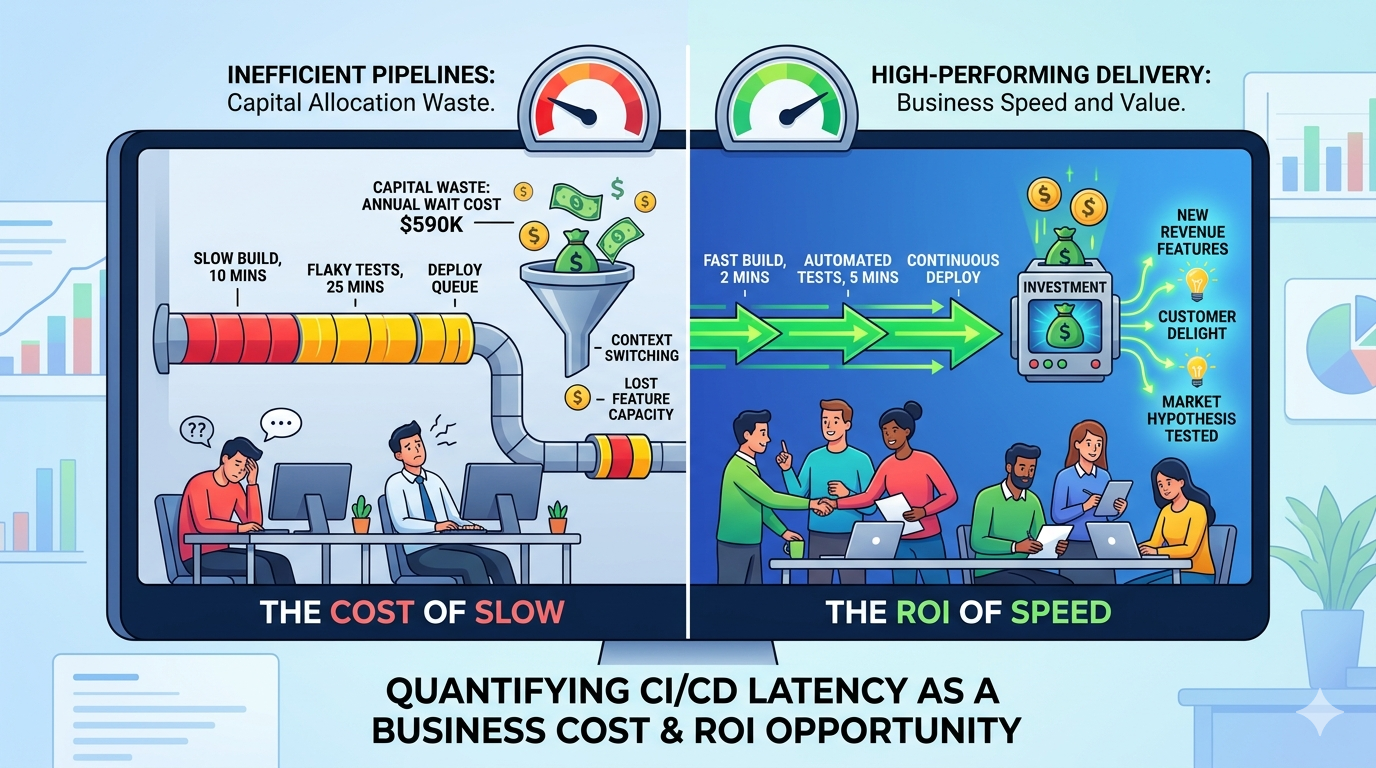
What the Gap Looks Like Economically
Using the formula established in Section 1, we can quantify the economic difference between these two cohorts. Assume a 40-engineer team:
Low-performing cohort pattern (from DORA 2023):
- Deployment frequency: monthly
- Lead time: 1–6 months
- Typical wait per engineer per day: 10–12 minutes (due to slow feedback, reruns, and approval queues)
Annual wait cost: 40 engineers × 6 events/day × 11 minutes/event × 220 days × $1.70 ≈ $590K
Elite-performing cohort pattern (from DORA 2023):
- Deployment frequency: on-demand (multiple times per day)
- Lead time: under 1 hour
- Typical wait per engineer per day: 2–3 minutes (fast feedback, high automation)
Annual wait cost: 40 engineers × 6 events/day × 2.5 minutes/event × 220 days × $1.70 ≈ $134K
The economic gap: approximately $456K annually in avoided wait time waste alone, before accounting for differences in incident cost, defect escape rate, or delivery speed.
The DORA research shows that this gap compounds beyond just wait time. Teams with faster feedback and more frequent deployments catch defects sooner, experience lower change failure rates, and achieve faster incident recovery—all of which reduce total cost of ownership.
What the Constraints Usually Are
Organizations making the transition from low to elite performance typically tackle a few dominant constraints. These are identified in The DevOps Handbook and confirmed across DORA research:
- Long serial test stages — Integration and end-to-end tests running sequentially rather than in parallel. According to Humble and Farley in Continuous Delivery, parallelizing test stages is one of the most direct levers for reducing overall pipeline duration, since the commit stage must complete before subsequent stages can begin.
- Under-provisioned CI execution infrastructure — Queuing for available executors. When more commits arrive than the system can process, developers wait for capacity. Adding execution capacity reduces wait without changing test count or duration.
- High flaky-test rerun rates — Tests that pass and fail non-deterministically force reruns and create cognitive load for developers. The SRE Workbook defines toil as work with no lasting value; debugging and re-running flaky tests is exactly this kind of toil. Addressing flaky tests directly improves throughput.
- Manual approval queues without risk-based justification — Requiring human sign-off on every production deploy adds latency regardless of pipeline confidence. The DevOps Handbook identifies manual approval gates as a form of handoff delay. Risk-based approval (automated for low-risk changes, manual review for high-risk ones) preserves safety while reducing queue time.
Each of these sits on the critical path of most changes. Removing latency from any of them benefits every developer on every build, every day. DORA research shows that elite teams systematically address these constraints; low performers allow them to accumulate.
The Compounding Effect
The gains compound over time. As feedback loops tighten and confidence increases, teams deploy more frequently. DORA 2023 data shows that elite teams deploy on-demand, while low performers deploy monthly or less. More frequent deployments expose issues sooner, which keeps them small and cheap to fix. Smaller changes have lower failure rates, which builds more confidence, which enables further acceleration. The alternative — slower pipelines — compounds in the opposite direction: long feedback loops hide problems until they are large, large changes fail more often, failures erode confidence, which slows deployment even further.
This virtuous cycle is documented in case studies from organizations like Google, Amazon, GitHub, and others. The common pattern: teams that prioritize feedback speed not only ship faster but also achieve lower failure rates and faster incident recovery. The financial benefit is real, measurable, and evident in DORA research.
Conclusion: Slow Pipelines Are Capital Waste
A slow pipeline is not only a technical debt story. It is a recurring financial leak.
When CI/CD latency accumulates across teams, the organization pays three times:
- direct labor waste
- opportunity cost from delayed feature delivery
- elevated risk cost from slower feedback and larger change batches
The organizations that treat pipeline speed as a strategic capability gain more than happier engineers. They gain faster learning cycles, stronger execution reliability, and better capital efficiency per engineer.
The right next step is straightforward: measure current pipeline economics, identify the dominant constraint, run a focused improvement program, and report results in business terms. Once the cost model is visible, CI/CD speed usually becomes one of the easiest infrastructure investments to justify.
Resources for Additional Learning
-
Gene Kim, Jez Humble, Patrick Debois, John Willis. The DevOps Handbook https://itrevolution.com/product/the-devops-handbook-second-edition/
-
Nicole Forsgren, Jez Humble, Gene Kim. Accelerate: The Science of Lean Software and DevOps https://itrevolution.com/product/accelerate/
-
DORA State of DevOps Report (Google Cloud) https://dora.dev/research/
-
McKinsey. Developer Velocity Index and related developer productivity research. https://www.mckinsey.com/capabilities/mckinsey-digital/our-insights/developer-velocity-how-software-excellence-fuels-business-performance
-
Martin Fowler. Continuous Integration. https://martinfowler.com/articles/continuousIntegration.html
-
Jez Humble and Dave Farley. Continuous Delivery. https://continuousdelivery.com/
-
GitLab Global DevSecOps Report. https://about.gitlab.com/developer-survey/
-
JetBrains Dev Ecosystem and tooling reports. https://www.jetbrains.com/lp/devecosystem-2024/